

Image Details
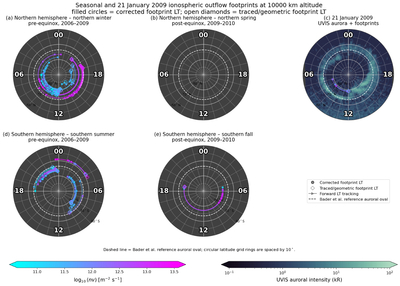
Caption: Figure 2.
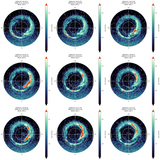
Ionospheric outflow footprints mapped to 10,000 km altitude, shown in polar projection (colatitude radially, LT azimuthally; the Bader average auroral oval overlaid as dashed line in each panel) and split by hemisphere and season: (a) northern winter, pre-equinox 2006–2009; (b) northern spring, post-equinox 2009–2010; and (c) 2009 January 21 with the contemporaneous UVIS auroral image in the background (log-scaled brightness, dedicated kR color bar). The rest of the available images for the day are shown in Figure A1, the one reported here is the closest in time to the ions leaving the ionosphere; (d) southern summer, pre-equinox 2006–2009; (e) southern fall, post-equinox 2009–2010. For every detection the travel-time-corrected footprint LT (filled circle) and the geometric footprint LT at the time of the spacecraft measurement (open diamond) are both plotted and joined by a curved arrow indicating corotation from the former to the latter. Marker color encodes the number flux ﹩{\mathrm{log}}_{10}(nv)﹩ at 104 km on the shared scale at right, so flux values can be compared directly across hemispheres and seasons.
Other Images in This Article
Copyright and Terms & Conditions
© 2026. The Author(s). Published by the American Astronomical Society.

