

Image Details
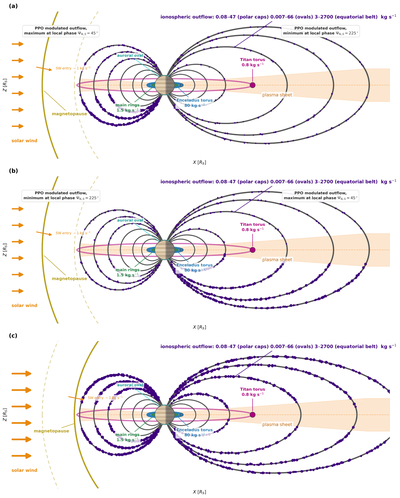
Caption: Figure 7.
Summary schematic of Saturn’s plasma mass sources in the X–Z (noon–midnight meridian) plane, Sun to the left, after Figure 4 of M. Yamauchi (2019). Color identifies each source (outflow purple, Enceladus blue, rings green, Titan pink); the outflow rate is given by the number and size of the particles drawn on the auroral oval and polar cap field lines, where our detections map. Panels (a) and (b) are typical solar wind conditions half a PPO rotation apart: each local-time sector is labeled with its local PPO phase, ΨN,S = 45∘ in the maximum-outflow sector and ΨN,S = 225∘ in the minimum, the maximum falling on the dayside in panel (a) and on the nightside in panel (b), with the drawn outflow modulated accordingly. Panel (c) is the compressed 2006 August 15–21 state (Pram = 0.037 nPa, R0 = 21 RS), with outflow elevated at all local times (23.9 kg s−1 north, 3.7 kg s−1 south). Fixed plasma sources: Enceladus 80 kg s−1 (B. L. Fleshman et al. 2013), Titan 0.8 kg s−1, rings 1.5 kg s−1 (W. M. Farrell et al. 2008), solar wind entry ∼1 kg s−1. Saturn and the moons are enlarged relative to the distance scale; this is a conceptual schematic, with Saturn not to scale, and not a field model.
Other Images in This Article
Copyright and Terms & Conditions
© 2026. The Author(s). Published by the American Astronomical Society.

