

Image Details
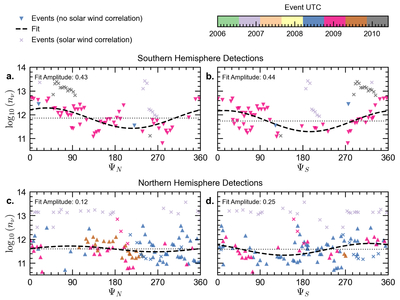
Caption: Figure 5.
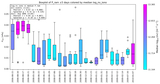
Variation of ﹩{\mathrm{log}}_{10}({n}_{\nu })﹩ for identified plasma outflow detections as a function of PPO phase. Events are organized by the local northern and southern PPO phase angles at the corrected LT, ΨN, and ΨS, and separated according to whether they were detected in the northern or southern hemisphere. Triangle markers (upward for northern hemisphere and downward for southern) denote events included in the sinusoidal fits, while x markers denote events potentially associated with enhanced solar wind pressure, visible in Figure 4 or magnetopause reconnection, and excluded from the fitting analysis. Solid curves show sinusoidal fits used to guide the eye.
Other Images in This Article
Copyright and Terms & Conditions
© 2026. The Author(s). Published by the American Astronomical Society.

