

Image Details
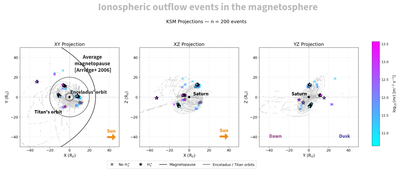
Caption: Figure 1.
Ionospheric outflow events mapped in Saturn’s magnetosphere in KSM coordinates. The 200 detections satisfying criteria (1)–(4) and the hemisphere-consistency and distance (<40 RS) criteria: left, XY plane (Saturn as seen from above) with average magnetopause from C. S. Arridge et al. (2006) and orbits of Enceladus (4 RS) and Titan (20 RS); middle, XZ plane (dawn-side view); right, YZ plane (sunward view). Indicated with star is the subset of detections with potential ﹩{{{\rm{H}}}_{3}}^{+}﹩ in the TOF composition, besides H+ and m/q = 2. Color scale is ﹩{\mathrm{log}}_{10}(nv)﹩ in m−2 s−1.
Other Images in This Article
Copyright and Terms & Conditions
© 2026. The Author(s). Published by the American Astronomical Society.

Copyright ©
2026 Astronomy Image Explorer. All Rights Reserved.
