

Image Details
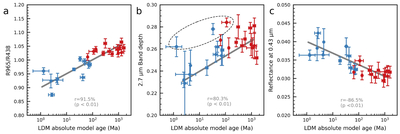
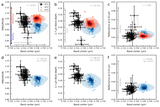
Caption: Figure 7.
Correlations between the LDM age and the corresponding spectral features of some typical regions (N. Schmedemann et al. 2016; K. Stephan et al. 2019). The LDM ages vs. (a) 965/438 nm ratio, (b) 2.7 µm band depth, and (c) reflectance factor at 438 nm. The blue and red scatter points represent the ST2 and ST3, respectively. The gray oval illustrates the outliers in 2.7 µm caused by compositional differences (K. Stephan et al. 2019): Dantu, Rao, and Cacaguat craters.
Other Images in This Article
Show More
Copyright and Terms & Conditions
© 2026. The Author(s). Published by the American Astronomical Society.

Copyright ©
2026 Astronomy Image Explorer. All Rights Reserved.
