

Image Details
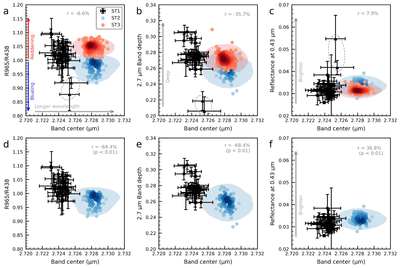
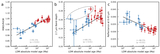
Caption: Figure 5.
Correlations between 2.7 µm band center and other spectral features for all surface types (a)–(c) and for ST1 and ST2 only (d)–(f). The 2.7 µm band center vs. (a) and (d) 965 nm/438 nm ratio; (b) and (e) 2.7 µm band depth; and (c) and (f) reflectance factor at 438 nm. The black, blue, and red scatter points represent the ST1, ST2 and ST3, respectively. The error bars for ST1 denote the standard deviations of the selected ROIs. For ST2 and ST3, color shading indicates the density of data points for those areas, and the semitransparent colored regions mark the approximate ranges after accounting for the standard deviations of the corresponding spectral parameters. The correlation coefficients between 2.7 µm band center and other spectral features are noted in the figure, excluding the two ST1 points enclosed by the gray oval, which may have different compositions.
Other Images in This Article
Show More
Copyright and Terms & Conditions
© 2026. The Author(s). Published by the American Astronomical Society.

