

Image Details
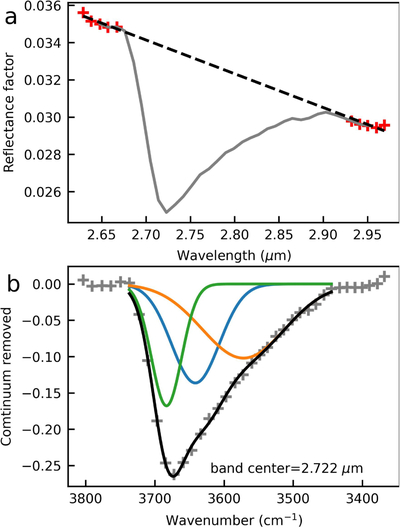
Caption: Figure 1.
2.7 µm absorption feature on Ceres. (a) An example of the 2.7 µm absorption band. The black dashed line is the continuum calculated by a linear regression from the absorption shoulders marked with red crosses. (b) Three Gaussian functions fitted to the continuum-removed 2.7 µm absorption band. The band center derived from the model fitting is noted.
Other Images in This Article
Show More
Copyright and Terms & Conditions
© 2026. The Author(s). Published by the American Astronomical Society.

Copyright ©
2026 Astronomy Image Explorer. All Rights Reserved.
