

Image Details
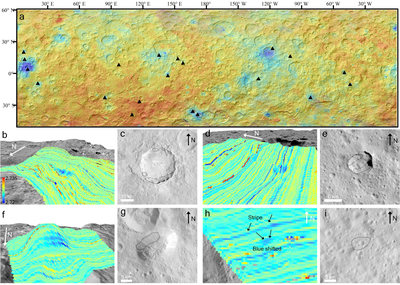
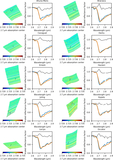
Caption: Figure 4.
Distribution of blueshifted regions on Ceres. (a) The blueshifted regions are marked with the black triangles. The background is color ratio F5(965 nm)/F8(438 nm) superimposed on hillshade map. Panels (b), (d) and (f) are 3D views of 2.7 µm band center mapping around the Haulani crater, Braciaca crater and Ahuna Mons region, respectively. Panels (c), (e) and (g) are FC clear filter images of the Haulani crater, Braciaca crater and Ahuna Mons region, respectively. The black dashed line illustrate the distribution of blueshifted regions. Panels (h) and (i) are 2.7 µm band center mapping and FC clear filter image of one unnamed small crater region (100.64∘W, 16.43∘N), respectively. The black arrows in (h) illustrate the blueshifted region and stripe noise.
Other Images in This Article
Show More
Copyright and Terms & Conditions
© 2026. The Author(s). Published by the American Astronomical Society.

