

Image Details
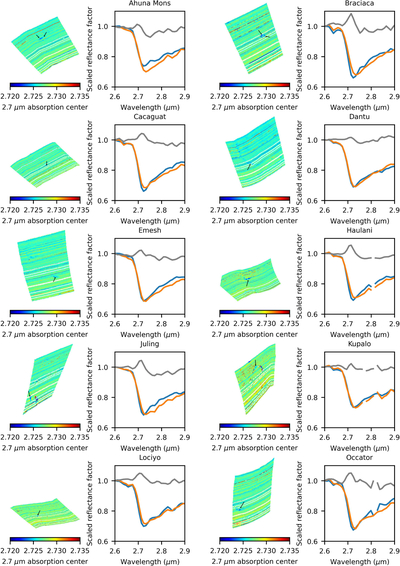
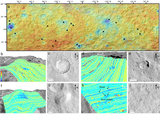
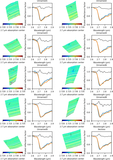
Caption: Figure C1.
2.7 µm band center mapping of different blueshifted regions and the corresponding spectra. The black arrows illustrate the location of blueshifted regions. The blue and orange spectra represent the blueshifted regions and adjacent background, respectively. The gray spectra are ratioed spectra of blueshifted and adjacent regions.
Other Images in This Article
Show More
Copyright and Terms & Conditions
© 2026. The Author(s). Published by the American Astronomical Society.

Copyright ©
2026 Astronomy Image Explorer. All Rights Reserved.
