

Image Details
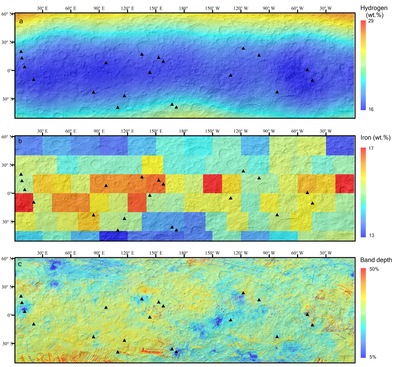
Caption: Figure D1.
Spatial distribution of the blueshifted regions overlaid on maps of (a) hydrogen abundance, (b) iron abundance, and (c) the 2.7 µm band depth of phyllosilicates on Ceres. The blueshifted regions are marked with the black triangles. These compositional maps are publicly available from the Planetary Data System archive at https://arcnav.psi.edu/urn:nasa:pds:context:investigation:mission.dawn_mission_to_vesta_and_ceres/more.
Other Images in This Article
Show More
Copyright and Terms & Conditions
© 2026. The Author(s). Published by the American Astronomical Society.

Copyright ©
2026 Astronomy Image Explorer. All Rights Reserved.
