

Image Details
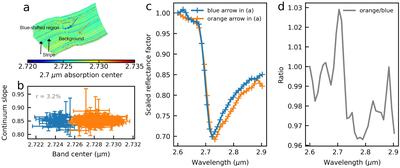
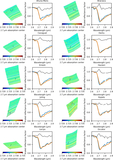
Caption: Figure 3.
Example of the 2.7 µm band center variation. (a) 2.7 µm band center map for the Haulani crater region. The blue and orange arrows indicate the locations of a blueshifted region and an adjacent background region, respectively. The black arrows indicate the stripe noise described in Section 3.2. (b) Correlation between the 2.7 µm band center and the continuum slope of this band. The blue and orange points represent the blueshifted regions and background, respectively. (c) Scaled spectra of the blueshifted and adjacent regions marked in (a). (d) Ratio of the background spectrum (orange) to the blueshifted spectrum (blue) shown in (c).
Other Images in This Article
Show More
Copyright and Terms & Conditions
© 2026. The Author(s). Published by the American Astronomical Society.

