

Image Details
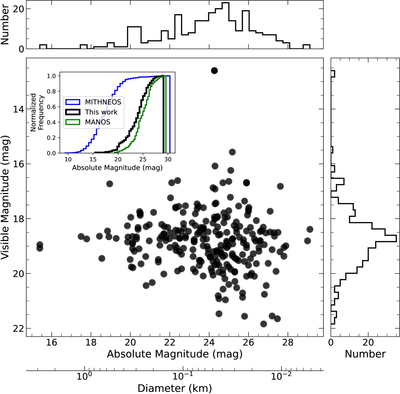
Caption: Figure 5.
Visible magnitude at the time of observation as a function of absolute magnitude HV for the UKIRT NEO survey. The top axis shows the estimated diameter derived from HV assuming a 15% albedo using the relation of A. W. Harris & J. S. V. Lagerros (2002). Most objects were observed at V < HV, highlighting the efficiency of the UKIRT NEO survey in targeting NEOs near peak in brightness. The bottom panel shows the cumulative HV distributions for the UKIRT NEO survey (black line), MANOS (green line), and MITHNEOS (blue line). The dashed black line indicates the marginal HV distribution of the UKIRT NEO survey.
Other Images in This Article
Copyright and Terms & Conditions
© 2026. The Author(s). Published by the American Astronomical Society.

