

Image Details
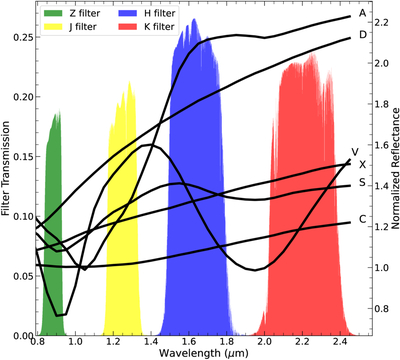
Caption: Figure 2.
UKIRT/WFCAM response functions for the Z, J, H, and K filters as a function of wavelength. The filter transmission values are displayed on the left y-axis. The black lines show the average reflectance at (right y-axis) for the Bus–DeMeo taxonomic classes used in our classification scheme. The reflectance was normalized at 0.55 μm.
Other Images in This Article
Copyright and Terms & Conditions
© 2026. The Author(s). Published by the American Astronomical Society.

Copyright ©
2026 Astronomy Image Explorer. All Rights Reserved.
