

Image Details
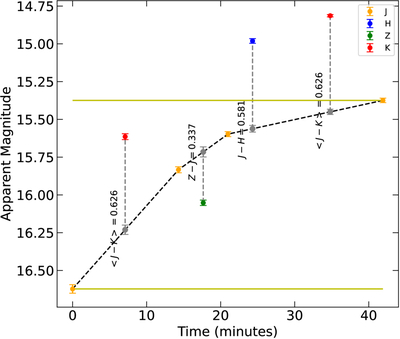
Caption: Figure 1.
Example of our lightcurve-correction approach and color determination for NEO 2022 VV2. The dashed black line illustrates the interpolated J-band lightcurve and the overplotted gray circles show the predicted magnitude, which is used to compute the lightcurve-corrected color at the time of a non-J-band observation. Each colored circle represents the binned magnitude obtained by combining all photometric measurements acquired in the corresponding filter. The horizontal yellow lines indicate the lightcurve amplitude of the target across the observing sequence. The colors shown in the figure have not been solar-color subtracted. That is, each respective color contains the Z − J = 0.369, J − K = 0.304, and J − H = 0.354 mag color of the Sun. The variability timescale is measured from the time difference at which the lightcurve reaches the respective minima and maxima during the range of observation. In this case, although a full lightcurve was not obtained, a confident argument that the object has a rotation period > 40 minutes can be made.
Other Images in This Article
Copyright and Terms & Conditions
© 2026. The Author(s). Published by the American Astronomical Society.

