

Image Details
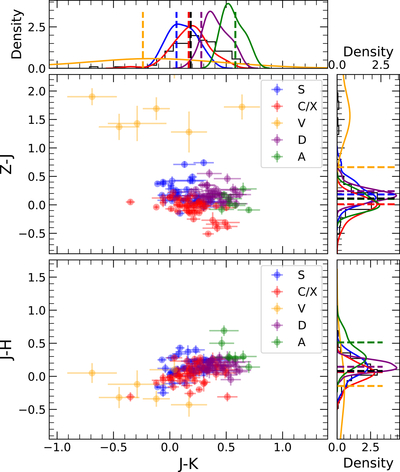
Caption: Figure 4.
Color–color diagram showing Z − J (top) and J − H (bottom) as a function of J − K for all classified objects in the UKIRT NEO survey. Colors and uncertainties are colored according to the object’s taxonomic classification. The top and rightmost subpanels show the kernel density distributions for each color for objects classified as C/X (red), S (blue), V (yellow), D (purple), and A (green). Vertical dashed lines indicate the colors of the average taxonomy spectra.
Other Images in This Article
Copyright and Terms & Conditions
© 2026. The Author(s). Published by the American Astronomical Society.

Copyright ©
2026 Astronomy Image Explorer. All Rights Reserved.
