

Image Details
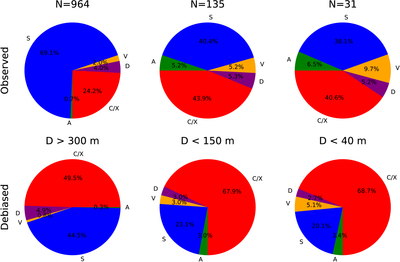
Caption: Figure 7.
The observed (top) and debiased (bottom) fractional taxonomic distributions are illustrated for three size bins denoted in between the top and bottom pie charts. The letter N at the top indicates the number of asteroids included in each bin. The blue, red, purple, green, and yellow colors represent the fraction of S, C/X, D, A, and V objects per bin, respectively. The left pie charts illustrate the taxonomic fractions of the MITHNEOS survey obtained from M. Marsset et al. (2022). The center and rightmost pie charts shows the taxonomic fractions obtained in this work.
Other Images in This Article
Copyright and Terms & Conditions
© 2026. The Author(s). Published by the American Astronomical Society.

Copyright ©
2026 Astronomy Image Explorer. All Rights Reserved.
