

Image Details
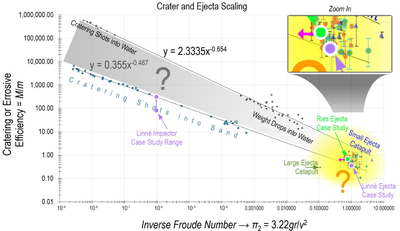
Caption: Figure 11.
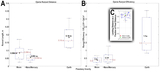
Annotated reproduction of Figure 9. The crater ejecta emplacement in M/m versus π2 parameter space is consistent with existing relationships, but uncertainties remain. Ejecta may roughly follow the established power laws for cratering; ejecta M/m values may not strongly depend on π2 values (Figure 7); ejecta M/m and π2 values may not show any correlation (bottom right yellow zone); or something else. Symbology is the same as for Figure 9. The magenta arrow shows the approximate change in π2 values if footprint width w is halved, putting experiments more in line with the power law for cratering shots into sand. The case study results concerning Linné and Ries craters are shown in the lavender and green data points and labeled, showing agreement with experiments. The inset zooms in on the experimental and case study results. More experiments and potentially numerical modeling across a broader parameter space will be necessary to better predict M/m, π2, runout, and other ejecta behavior.
Other Images in This Article
Show More
Copyright and Terms & Conditions
© 2026. The Author(s). Published by the American Astronomical Society.

