

Image Details
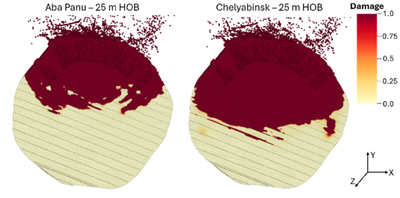
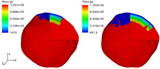
Caption: Figure 11.
Similar to Figure 10, this figure compares the damaged material in the AP25 (left) and C25 (right) simulations at 34 ms. Both simulations use the same HOB and achieve similar final deflection velocities. However, C25 shows more extensive damage than AP25, because of the differences in the Weibull parameters used in the damage model. The fraction of fully damaged material is 60.2% and 34.2% for the C25 and AP25 simulations, respectively.
Other Images in This Article
Show More
Copyright and Terms & Conditions
© 2026. The Author(s). Published by the American Astronomical Society.

Copyright ©
2026 Astronomy Image Explorer. All Rights Reserved.
