

Image Details
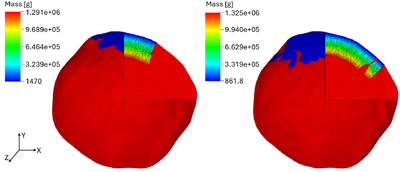
Caption: Figure 8.
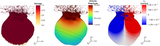
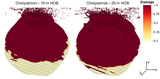
3D cutout images from the 10 m (left) and 25 m (right) HOB simulations at t = 0, color coded by mass. The red nodes in the lower region of the bodies represent a low-resolution bulk material. Moving upward (﹩+\hat{y}﹩-direction), nodes decrease in size and mass as they get closer to the top surface. The blue surface shows the smallest (and thinnest) nodes, which we need to resolve the energy deposition profile. Because of the irregular surface geometry of Bennu, the illuminated region is not uniform. Within the cutout region, the diagonal lines highlight the orientation of the low-resolution bulk nodes in a body-centered cubic lattice.
Other Images in This Article
Show More
Copyright and Terms & Conditions
© 2026. The Author(s). Published by the American Astronomical Society.

