

Image Details
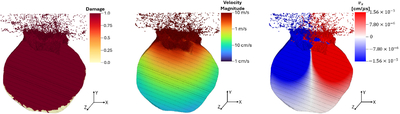
Caption: Figure 9.
Cutaway images of the C10 simulation at 145 ms, with material color coded by the material damage (left), the total velocity magnitude (middle), and the x-component of velocity (vx, in cm μs−1; right). In the right panel, the maximum limits in the color bar correspond to ±2 × vesc.
Other Images in This Article
Show More
Copyright and Terms & Conditions
© 2026. The Author(s). Published by the American Astronomical Society.

Copyright ©
2026 Astronomy Image Explorer. All Rights Reserved.
