

Image Details
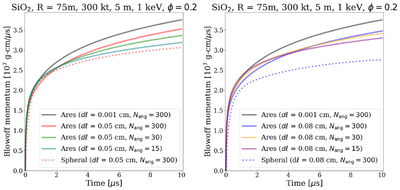
Caption: Figure 6.
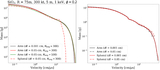
Comparing the evolution of the blow-off momentum between Ares and Spheral. The black line in both panels shows the fully resolved Ares simulation with initial surface resolution, dℓ, of 0.001 cm. The left and right panels compare the two simulation code results with dℓ = 0.05 cm and dℓ = 0.08 cm, respectively, where solid lines represent the Ares simulations and dotted lines represent Spheral simulations with comparable angular resolution, Nang = 300. We show comparisons of Ares with reduced angular resolution, Nang = 30 and Nang = 15, and find that these curves are more similar in shape and magnitude to the Spheral simulations, suggesting that Spheral is likely underresolving this problem. See Table 1 for a summary of results.
Other Images in This Article
Show More
Copyright and Terms & Conditions
© 2026. The Author(s). Published by the American Astronomical Society.

