

Image Details
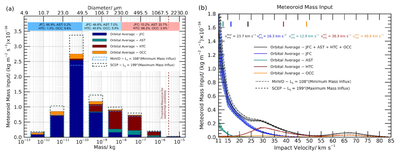
Caption: Figure 3.
Panel (a): mass histogram of the orbital-average meteoroid mass input before atmospheric entry, expressed in kg m−2 s−1, over the mass range considered by the DMZC model for Venus and partitioned into the JFCs (blue), the ASTs (green), HTCs (dark red), and the OCCs (orange). Panel (a) also illustrates the fluctuations in the overall mass influxes between the minimum vertical distance (MinVD, LS = 108°) and the second crossing of the ecliptic plane (SCEP, LS = 199°). The percentages at the top of panel (a) represent the relative mass contributions of each meteoroid population to the overall mass influx for three different mass intervals. Panel (b): orbital-average mass input over a Venusian year before atmospheric ablation as a function of the impact velocity for the JFCs (solid blue line), ASTs (solid green line), HTCs (solid dark red line), OCCs (solid orange line), and total mass flux (solid black line). The shaded regions represent the corresponding mass influxes between the MinVD and the SCEP. Panel (b) also shows the values of the average input velocities for each meteoroid population, and the vertical lines on the top compare the average input velocity of each meteoroid population and the total mass influx.
Other Images in This Article
Show More
Copyright and Terms & Conditions
© 2026. The Author(s). Published by the American Astronomical Society.

