

Image Details
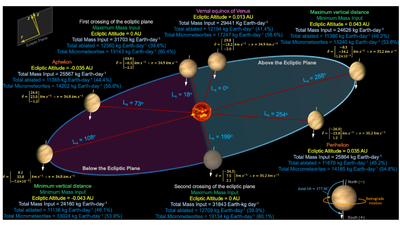
Caption: Figure 1.
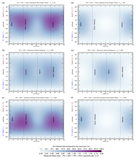
Diagram illustrating the variability with the orbital position (LS) of the total meteoroid mass influx before atmospheric entry, the total ablated mass into the upper atmosphere, and the total accreted mass of MMs at the Venusian surface assuming a CI-chondritic composition. The values in parentheses represent the fractions of both ablated mass and deposited MMs with respect to the total initial mass input before atmospheric ablation. This figure also illustrates the fluctuations of the three components of the velocity state vector with orbital position. Note that the mass fluxes are expressed in kilograms per Earth-day (1 Earth-day is equivalent to 1/116.75 of a Venus solar day or, similarly, 0.205567 Venusian hours).
Other Images in This Article
Show More
Copyright and Terms & Conditions
© 2026. The Author(s). Published by the American Astronomical Society.

