

Image Details
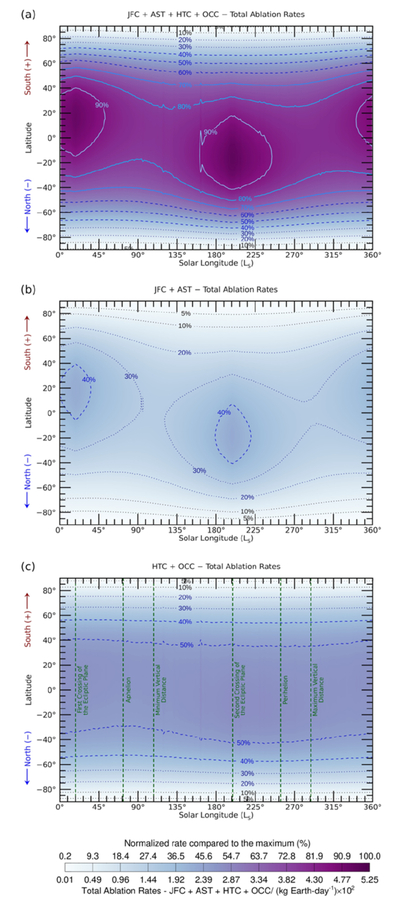
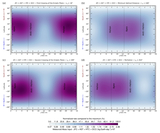
Caption: Figure 17.
Panel (a) shows the orbital and latitudinal variability of the total ablated mass injection rate, expressed in kilograms per Earth-day determined by CABMOD–MIF. Panels (b) and (c) represent the relative contribution to the overall mass input from the combination of the JFCs and the ASTs (a) and the HTCs and OCCs (c). The contour lines represent rates normalized to the maximum value. Black dotted contours indicate rates below 30%, blue dashed contours correspond to rates between 40% and 60%, and blue solid contours denote fluxes exceeding 70%.
Other Images in This Article
Show More
Copyright and Terms & Conditions
© 2026. The Author(s). Published by the American Astronomical Society.

Copyright ©
2026 Astronomy Image Explorer. All Rights Reserved.
