

Image Details
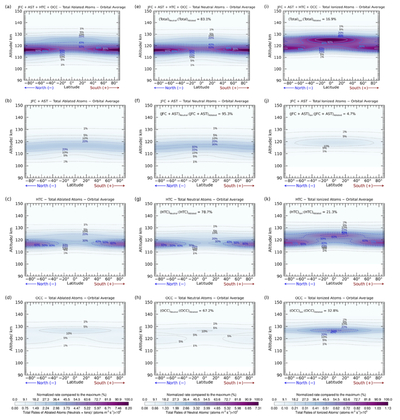
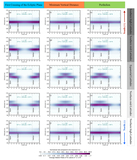
Caption: Figure 14.
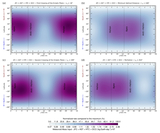
Panel (a) shows the orbital average of the overall ablation rates (in atoms m−3 s−1), incorporating the deposition profiles of all meteoric compounds estimated by CABMOD–MIF as a function of altitude and latitude. These rates are then split into the combined contribution of the JFCs and the ASTs (panel (b)), the HTCs (panel (c)), and the OCCs (panel (d)). The overall ablated fluxes are then divided into total neutral (panels (d), (e), and (f)) and ionized (panels (g), (h), and (i)) compounds, presented in the middle and the right columns, respectively. Additionally, these fluxes are further split into the relative contribution from each meteoroid population. The percentages at the top of these panels represent the fraction of neutral and ionized compounds relative to the total ablation rates, either to the overall ablation rates or to each meteoroid population. The contour lines represent rates normalized to the maximum value. Black dotted contours indicate rates below 30%, blue dashed contours correspond to rates between 40% and 60%, and blue solid contours denote fluxes exceeding 70%. Note that the color scales are different for each column of panels. An animation of the total ionization rates (panel (i)) as a function of altitude and latitude is available; the animation cycles through all solar longitudes, starting from aphelion LS = 73°, going to LS = 0°, and then to LS = 73°.
(An animation of this figure is available in the online article.)
(An animation of this figure is available.)
The video/animation of this figure is available in the online journal.
Other Images in This Article
Show More
Copyright and Terms & Conditions
© 2026. The Author(s). Published by the American Astronomical Society.

