

Image Details
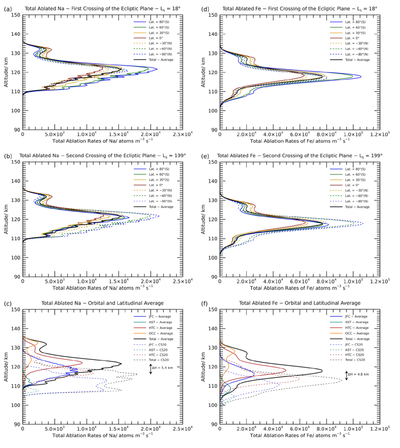
Caption: Figure 12.
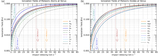
Total injection rates of ablated Na (panels (a), (b), and (c)) and Fe (panels (d), (e), and (f)), in atoms m−3 s−1, estimated by the CABMOD–MIF model for Venus. The top and middle panels present the latitudinal variability of the injection rates of Na and Fe at the first (panels (a) and (d)) and second (panels (b) and (e)) crossings of the ecliptic plane. The black solid lines in all of the panels represent the overall rates of Na and Fe averaged latitudinally and orbitally. Panels (c) and (f) show the relative contribution of the JFCs (blue), the ASTs (green), the HTCs (dark red), and the OCCs (orange) to the total injection rates of Na and Fe (black solid line); these panels also compare the results modeled by the CABMOD–MIF with those reported by J. D. Carrillo-Sánchez et al. (2020b) (CS20, dashed lines in panels (c) and (f)). Note that the wavy structure in the injection rates of Na (panels (a), (b), and (c)) is an artifact caused by the discretization of the mass distribution of the JFCs.
Other Images in This Article
Show More
Copyright and Terms & Conditions
© 2026. The Author(s). Published by the American Astronomical Society.

