

Image Details
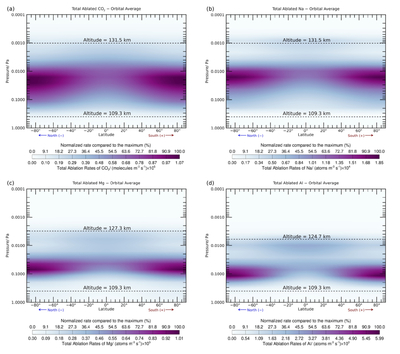
Caption: Figure 11.
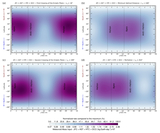
Orbital average of the total injection rates, expressed in atoms (or molecules) m−3 s−1, of ablated CO2 (panel (a)), Na (panel (b)), Mg (panel (c)), and Al (panel (d)) estimated by the CABMOD–MIF model as a function of pressure level and Venusian latitude. The top and bottom horizontal dashed lines illustrate the equivalent altitudes at which the ablation process starts and ends, respectively, for each meteoric metal. An animation showing the orbital variability of the ablation rates of CO2 (panel (a)), Na (panel (b)), Mg (panel (c)), and Al (panel (d)) as a function of pressure level and the Venusian latitude is available; the animation cycles through all solar longitudes, starting from aphelion LS = 73°, going to LS = 0°, and then to LS = 73°.
(An animation of this figure is available in the online article.)
(An animation of this figure is available.)
The video/animation of this figure is available in the online journal.
Other Images in This Article
Show More
Copyright and Terms & Conditions
© 2026. The Author(s). Published by the American Astronomical Society.

