Image Details
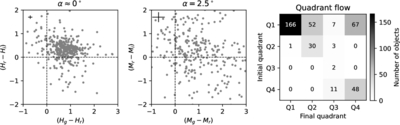
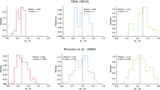
Caption: Figure 13.
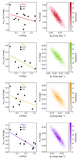
The left and middle panels show the color–color diagrams at α ≈ 0° and at α = 2﹩\mathop{.}\limits^{\unicode{x000b0}}﹩5. The dashed lines indicate the quadrant boundaries defined by the sign of the color indices. Numbers in each quadrant indicate the object counts. The right panel shows the transition matrix between quadrants, quantifying how objects redistribute between regions of the color–color space as a function of phase angle. The plus signs indicate representative 1σ uncertainties derived from the median propagated photometric errors.
Other Images in This Article
Show More
Copyright and Terms & Conditions
© 2026. The Author(s). Published by the American Astronomical Society.
Copyright ©
2026 Astronomy Image Explorer. All Rights Reserved.