Image Details
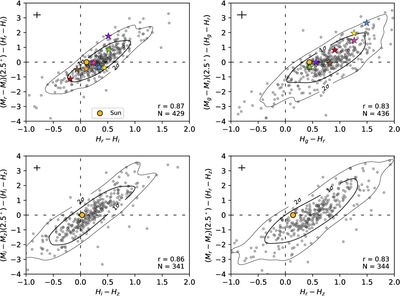
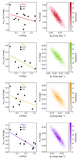
Caption: Figure 12.
Absolute color (α = 0°) vs. the color at α = 2﹩\mathop{.}\limits^{\unicode{x000b0}}﹩5 minus the absolute color (color at opposition). Each panel corresponds to one of the four color combinations with the strongest Pearson correlation: r − i, g − r, i − z, and r − z. Gray points represent the filtered sample, while black contours indicate the 68% and 90% density levels derived from a 2D Gaussian KDE. The yellow circle marks the solar color. Colored stars highlight selected RFL-LSST objects, using the same color scheme adopted in previous figures. The Pearson correlation coefficient and the number of objects are indicated in each panel. The crosses shown in each panel represent typical 1σ uncertainties, computed as the median propagated photometric uncertainty for each color combination.
Other Images in This Article
Show More
Copyright and Terms & Conditions
© 2026. The Author(s). Published by the American Astronomical Society.