

Image Details
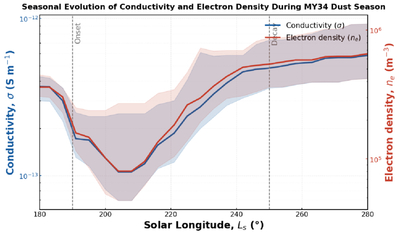
Caption: Figure 8.
Seasonal evolution of modeled near-surface conductivity and electron density during the MY 34 dust-storm season. The blue curve shows conductivity, σ, and the red curve shows electron density, ne; shaded envelopes indicate variability about the seasonal mean. Both quantities decline to a minimum near Ls ≈ 200°–210°, then increase through the main part of the storm and remain elevated into the mature and late stages. Their close correspondence indicates that the seasonal behavior of conductivity is strongly linked to the evolving free-electron population, while the smoother conductivity profile reflects the additional influence of mobility and collisional regulation.
Other Images in This Article
Show More
Copyright and Terms & Conditions
© 2026. The Author(s). Published by the American Astronomical Society.

