

Image Details
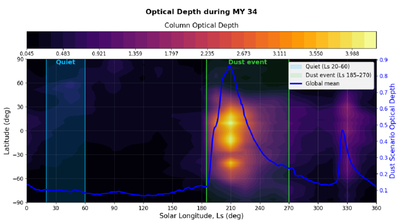
Caption: Figure 2.
Latitude–solar longitude (Ls) distribution of column dust optical depth (τ) during MY 34 from MCD v.6.1. Filled contours show τ, and the blue curve denotes the global-mean column dust optical depth (right axis). The blue and green shaded regions indicate the quiescent period (Ls = 20°–60°) and the MY 34 dust-storm interval (Ls = 185°–270°), respectively.
Other Images in This Article
Show More
Copyright and Terms & Conditions
© 2026. The Author(s). Published by the American Astronomical Society.

Copyright ©
2026 Astronomy Image Explorer. All Rights Reserved.
