

Image Details
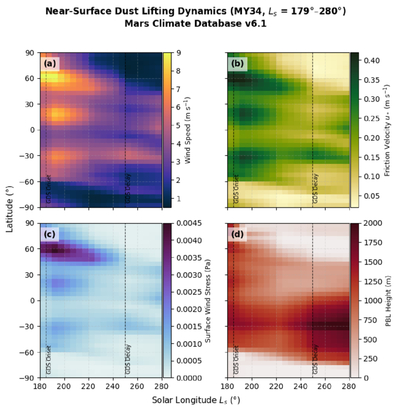
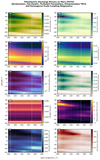
Caption: Figure 4.
Latitude–solar longitude (Ls) distributions of near-surface dynamical quantities associated with dust lifting during the MY 34 global dust storm from MCD v.6.1. Panels show the (a) near-surface wind speed, (b) friction velocity, (c) surface wind stress, and (d) PBL height. Vertical dashed lines mark the approximate onset and decay phases of the storm. The coordinated enhancement of these fields during the main storm interval indicates strengthened surface forcing and deeper turbulent mixing, both of which favor sustained dust lifting and transport.
Other Images in This Article
Show More
Copyright and Terms & Conditions
© 2026. The Author(s). Published by the American Astronomical Society.

Copyright ©
2026 Astronomy Image Explorer. All Rights Reserved.
