

Image Details
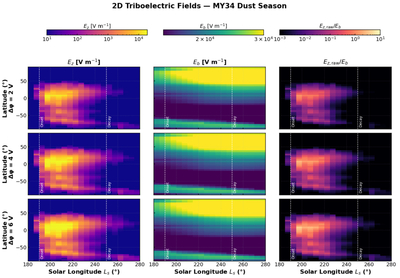
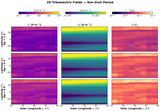
Caption: Figure 6.
Latitudinal–seasonal distributions of the modeled near-surface electrical state during the MY 34 dust-storm season. Rows correspond to Δϕ = 2, 4, and 6 V. Columns show the vertical electric field Ez (left), the breakdown field Eb (middle), and the ratio Ez/Eb (right). White dashed lines mark the approximate onset and late-decay phases of the storm interval. The largest Ez values occur during the early to mature storm stage and are concentrated mainly from low latitudes into the northern tropics, whereas Eb remains comparatively smooth and zonally organized. Regions where Ez/Eb approaches unity are localized, indicating that breakdown-favorable conditions arise only within restricted parts of the storm.
Other Images in This Article
Show More
Copyright and Terms & Conditions
© 2026. The Author(s). Published by the American Astronomical Society.

