

Image Details
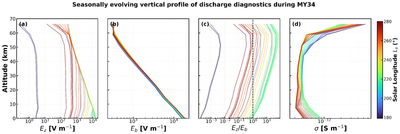
Caption: Figure 10.
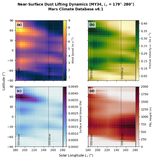
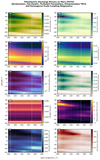
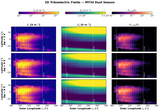
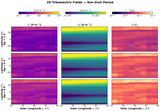
Seasonally evolving vertical profiles of the modeled discharge diagnostics during the MY 34 dust season. Panel (a) shows the self-consistent electric field Ez, panel (b) shows the effective breakdown field Eb, panel (c) shows the ratio Ez/Eb, and panel (d) shows the effective conductivity σ. Curves are colored by solar longitude Ls, and the dashed line in panel (c) marks the nominal breakdown threshold Ez/Eb = 1. The figure focuses on the lowest 70 km of the atmosphere, where triboelectric source generation, conductivity suppression, and breakdown-favorable conditions interact most strongly.
Other Images in This Article
Show More
Copyright and Terms & Conditions
© 2026. The Author(s). Published by the American Astronomical Society.

