

Image Details
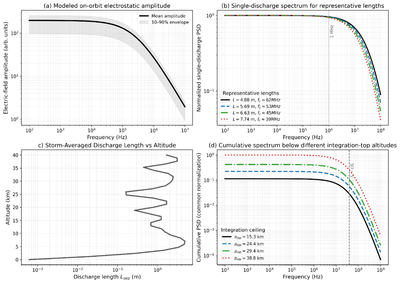
Caption: Figure 13.
Modeled frequency-domain characteristics of dust-driven electrical discharges during the MY 34 global dust storm. (a) Mean storm electrostatic field amplitude spectrum evaluated at the spacecraft altitude, shown as the square root of the modeled on-orbit PSD; shading denotes the 10%–90% range across modeled storm realizations. (b) Single-discharge electrostatic PSD for representative discharge separation lengths Lsep, illustrating the systematic shift of the spectral knee frequency with discharge scale according to fc ∼ c/Lsep. (c) Storm-averaged vertical profile of the effective discharge separation length Lsep, showing that the characteristic discharge scale varies substantially with altitude within the active storm column. (d) Normalized cumulative on-orbit PSD obtained by integrating the discharge contributions only up to different integration-top altitudes. The broad overlap among the curves indicates that the low- and intermediate-frequency spectral shape is controlled mainly by the lower and middle portions of the storm column, while the high-frequency roll-off remains sensitive to the largest discharge scales included. The vertical dashed line marks the scaling reference ﹩{f}_{c}\sim c/{L}_{{\rm{\max }}}﹩.
Other Images in This Article
Show More
Copyright and Terms & Conditions
© 2026. The Author(s). Published by the American Astronomical Society.

