

Image Details
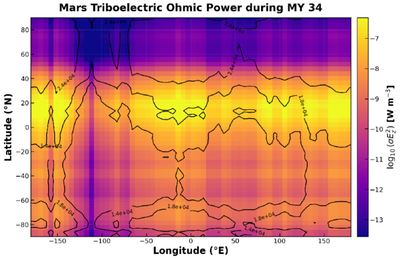
Caption: Figure 12.
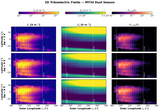
Reconstructed global distribution of near-surface triboelectric ohmic dissipation during the MY 34 dust-storm season. The quantity shown is ﹩{\mathrm{log}}_{10}(\sigma {E}_{z}^{2})﹩, where σ is the effective electrical conductivity and Ez is the modeled vertical electric field. Colors represent the local volumetric rate of conductive electrical energy dissipation, while black contours indicate the reference levels of the modeled field structure. Enhanced dissipation is concentrated within a broad, low- to midlatitude storm-active belt with clear longitudinal modulation, indicating that the strongest near-surface electrical energy loss occurs where dust-driven charging, field amplification, and conductive relaxation overlap most effectively.
Other Images in This Article
Show More
Copyright and Terms & Conditions
© 2026. The Author(s). Published by the American Astronomical Society.

