Image Details
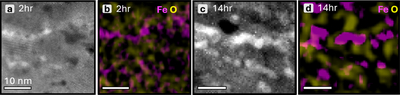
Caption: Figure A2.
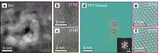
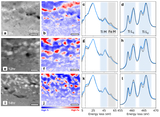
Concentration of Fe and O in SSW rims. (a) HAADF image of the 2 hr sample. (b) Overlay of Fe (pink) and O (yellow) concentration maps (see Section 2) for the 2 hr sample. (c), (d) Same as (a), (b), but for the 14 hr sample.
Other Images in This Article
Show More
Copyright and Terms & Conditions
© 2026. The Author(s). Published by the American Astronomical Society.
Copyright ©
2026 Astronomy Image Explorer. All Rights Reserved.