Image Details
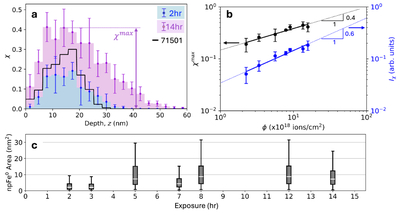
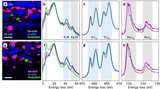
Caption: Figure 5.
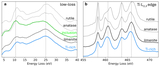
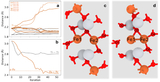
Distribution of npFe0 in SSW rims. (a) Density distribution of npFe0 (χ) vs. depth for the SSW rims (2 hr in blue, 14 hr in purple), overlaid with the distribution for 71501 ilmenite (black). (b) Power-law fits to the maximum of χ distributions (﹩{\chi }^{\max }﹩; left axis, black) and normalized integrated density of npFe0 coverage (Iχ; right axis, blue). (c) Size distribution of npFe0 for all exposures. Data for npFe0 distributions are extracted from image segmentation of HAADF images (see Section 2.2.2).
Other Images in This Article
Show More
Copyright and Terms & Conditions
© 2026. The Author(s). Published by the American Astronomical Society.
Copyright ©
2026 Astronomy Image Explorer. All Rights Reserved.