Image Details
Caption: Figure 4.
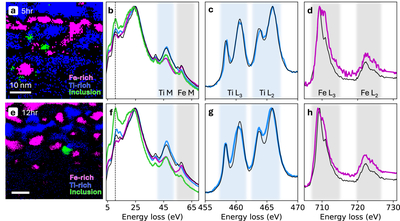
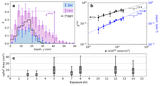
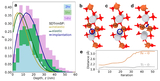
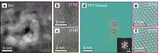
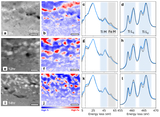
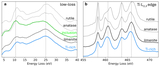
EELS fine structure of features in SSW rims. (a) Overlaid Fe (magenta) and Ti (blue) concentration maps (see Section 2.2.3) of the 5 hr sample in the same region as Figure 3(a). The dark inclusions in Figure 3(a) are shown in green. (b) EELS low-loss spectra averaged over the color-coded regions in (a). The dashed line indicates a characteristic ∼10.5 eV peak. (c) Ti L-edge ELNES spectrum averaged over the Ti-rich (blue) region in (a). (d) Fe L-edge ELNES spectrum averaged over the Fe-rich (magenta) region in (a). All spectra are plotted alongside that from unexposed ilmenite (black). (e)–(h) Same as (a)–(d), but for the 12 hr sample.
Other Images in This Article
Show More
Copyright and Terms & Conditions
© 2026. The Author(s). Published by the American Astronomical Society.