Image Details
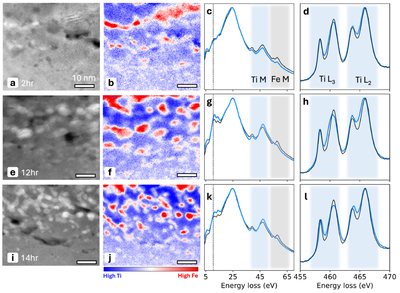
Caption: Figure A5.
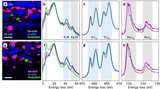
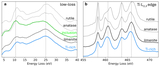
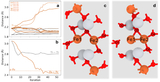
EELS characterization of Ti-rich regions in SSW rims. (a) HAADF image of the 2 hr sample. (b) Fe/Ti ratio map (see Section 2) of the 2 hr sample in the same region as (a). (c) EELS low-loss spectra of the Ti-rich regions (blue) in (b) along with spectra from unexposed ilmenite (black). Dashed line marks the 10.5 eV peak, which arises from the formation of a TiO2 phase. (d) Ti L-edge spectra of the Ti-rich regions (blue) alongside an unexposed ilmenite spectrum (black). (e)–(h) Same as (a)–(d), but for the 12 hr sample. (i)–(l) Same as (a)–(d), but for the 14 hr sample.
Other Images in This Article
Show More
Copyright and Terms & Conditions
© 2026. The Author(s). Published by the American Astronomical Society.
Copyright ©
2026 Astronomy Image Explorer. All Rights Reserved.