Image Details
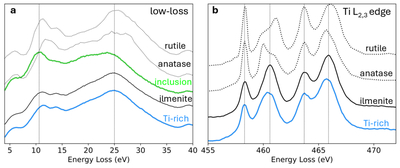
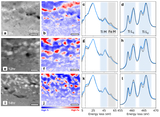
Caption: Figure A6.
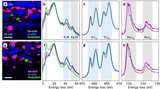
Comparison of standards with Ti-rich regions from 12 hr exposure. (a) EELS low-loss region. (b) Ti L2,3-edge. Spectra are plotted for the dark inclusion (green, averaged over region in Figure 4(e)), Ti-rich region (blue, averaged over region in Figure 4(e)), ilmenite (black, acquired from unaltered regions), rutile (dotted black; M. Launay et al. 2004), and anatase (dotted black; M. Launay et al. 2004).
Other Images in This Article
Show More
Copyright and Terms & Conditions
© 2026. The Author(s). Published by the American Astronomical Society.
Copyright ©
2026 Astronomy Image Explorer. All Rights Reserved.