Image Details
Caption: Figure 3.
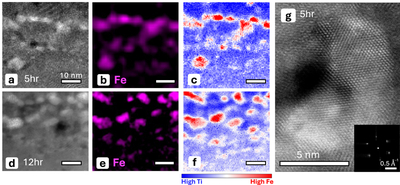
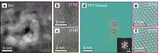
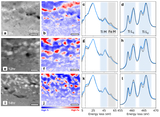
Compositional and structural characterization of npFe0 regions in SSW rims. (a) HAADF image of the 5 hr sample. (b) Fe concentration map (see Section 2.2.3) of the 5 hr sample in the same region as (a). (c) Fe/Ti ratio map (see Section 2.2.3) of the 5 hr sample in the same region as (a). (d)–(f) Same as (c), but for the 12 hr sample. (g) High-resolution HAADF image of npFe0 in the 5 hr sample with d-spacing corresponding to the {110} family of planes in α-Fe. Inset: fast Fourier transform of the crystalline npFe0 region.
Other Images in This Article
Show More
Copyright and Terms & Conditions
© 2026. The Author(s). Published by the American Astronomical Society.
Copyright ©
2026 Astronomy Image Explorer. All Rights Reserved.