Image Details
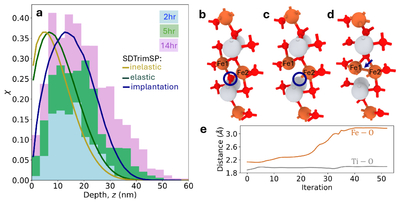
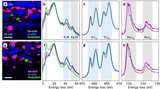
Caption: Figure 6.
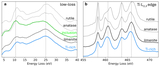
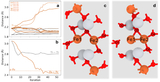
Energy deposition and npFe0 initiation for D+-irradiated ilmenite. (a) Comparison of npFe0 distributions (χ(z)) for 2 hr (blue), 5 hr (green), and 14 hr (purple) with SDTrimSP results. Energy losses to electronic (inelastic, yellow) and nuclear (elastic, green) processes from SDTrimSP are scaled to ﹩{\chi }^{\max }﹩ for the 14 hr exposure to show the depth dependence of energy loss. The implantation profile of D+ ions (blue) is also overlaid. (b)–(e) DFT simulation of FeTiO3. Snapshots showing (b) starting ilmenite lattice, (c) the initial state with the removal of a single O atom (blue circle), and (d) the final state resulting in the formation of an Fe–Fe bond (blue arrow). (e) Fe–O (gold) and Ti–O (gray) distances vs. DFT iteration step.
Other Images in This Article
Show More
Copyright and Terms & Conditions
© 2026. The Author(s). Published by the American Astronomical Society.