Image Details
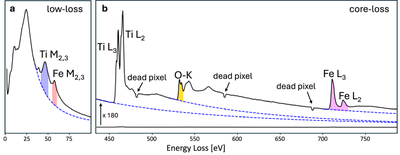
Caption: Figure A1.
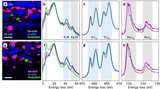
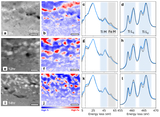
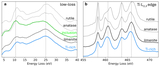
Spectral analysis of EELS low-loss and core-loss spectra. EELS low-loss (a) and core-loss (b) spectra from the 2 hr exposed ilmenite sample. Power-law background subtractions (blue dashed lines) are shown for each elemental edge in (a) and (b). (a) Integration window for the EELS Ti M-edge (blue) and Fe M-edge (red). (b) Integration window for the O K-edge (yellow) and Fe L-edge (magenta). Dead pixels are due to the gaps between the three EELS detectors (see Section 2).
Other Images in This Article
Show More
Copyright and Terms & Conditions
© 2026. The Author(s). Published by the American Astronomical Society.
Copyright ©
2026 Astronomy Image Explorer. All Rights Reserved.