

Image Details
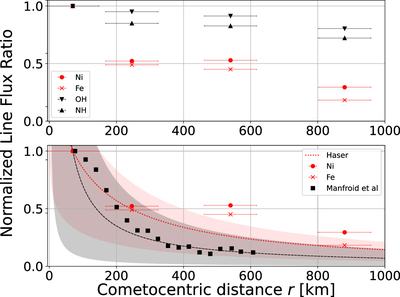
Caption: Figure 9.
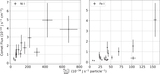
Top: spatial distributions of nickel, iron, and molecular lines normalized to 1 at photocenter (r = 70 km). Ni (circles) and Fe (crosses) flux ratios were taken as the mean of I(r)/I(r = 70) of the seven Ni and four Fe (7) lines present at all four distances. OH (downward-pointing triangles) and NH (upward-pointing triangles) fluxes and cometocentric distances were digitized from Meier et al. (1998). Bottom: comparison of present Ni and Fe lines (red circles and red crosses, respectively) to the Fe line profile of comet 103P/Hartley 2 (squares, shifted +70 km) reported in Manfroid et al. (2021). A 1/r profile normalized to 1 at r = 70 km is shown in black, with gray contours indicating position uncertainty of the 0″ pointing of Hyakutake. A Haser model of atomic Ni is shown as a dotted red line, assuming daughter and parent scale lengths of 8.9 × 10⁵ km and 200 km, respectively, with red shaded contours showing the uncertainty of the Ni Haser spatial distribution assuming the uncertainty of the photocenter pointing at 0″.
Other Images in This Article
Copyright and Terms & Conditions
© 2021. The Author(s). Published by the American Astronomical Society.

