

Image Details
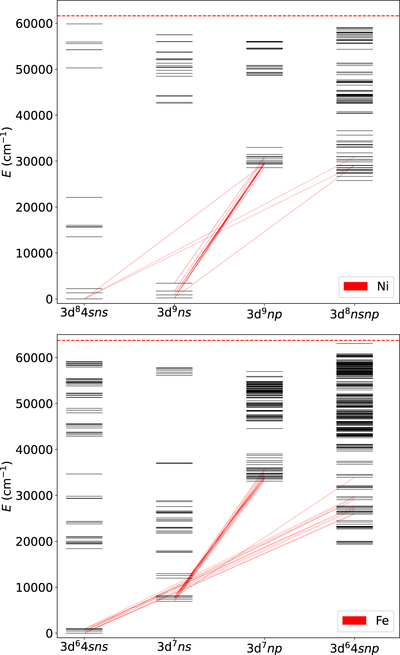
Caption: Figure 6.
Grotrian diagrams of Ni I (top) and Fe I (bottom) showing the observed emission lines of each element as diagonal red lines. Ionization limits are shown as horizontal dashed lines. Many lines are known for each element (522 for Ni, 2539 for Fe), but only the observed lines are shown for clarity.
Other Images in This Article
Copyright and Terms & Conditions
© 2021. The Author(s). Published by the American Astronomical Society.

Copyright ©
2026 Astronomy Image Explorer. All Rights Reserved.
