

Image Details
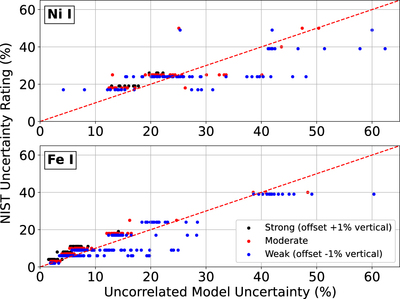
Caption: Figure 3.
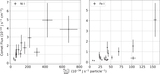
Top: model uncertainties for the fluorescence spectrum of Ni I, calculated as the standard deviation of line intensities following 106 iterations within the limits of ± ASD accuracy (see Table 1) vs. the ASD accuracy rating for 134 selected transitions with model uncertainties <100%. Axis limits were restricted to enhance visibility of the majority (>99%) of lines within this criterion. Strong and weak lines are offset ±1% vertically with respect to moderate lines for visibility; for definitions of line classifications, see text. Bottom: Fe I model uncertainties vs. ASD accuracy ratings for 425 select transitions with uncertainties lower than 100%: 67 strong, 108 moderate, and 250 weak.
Other Images in This Article
Copyright and Terms & Conditions
© 2021. The Author(s). Published by the American Astronomical Society.

