

Image Details
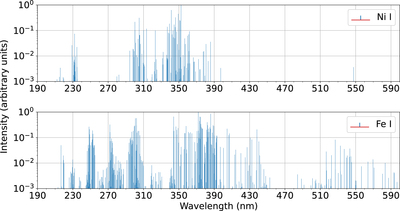
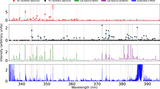
Caption: Figure 1.
Synthetic fluorescence spectra stick plots on a logarithmic intensity scale with the strongest lines normalized to 1 for Ni I (top) and Fe I (bottom) spanning 190–600 nm. Line intensities were calculated for the observing conditions of C/1996 B2 Hyakutake, v h = −36.7 km s−1 and r h = 1.02 au.
Other Images in This Article
Copyright and Terms & Conditions
© 2021. The Author(s). Published by the American Astronomical Society.

Copyright ©
2026 Astronomy Image Explorer. All Rights Reserved.
