

Image Details
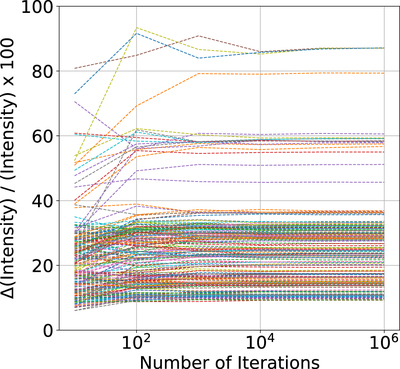
Caption: Figure 2.
Ratio of line intensity standard deviation to line intensity (in percentage) for 213 Ni I lines spanning 300–500 nm as a function of iteration number (see text). Spectra were generated at the orbital conditions of the closest approach of C/1996 Hyakutake and are plotted at 10, 102, 103, 104, 105, and 106 iterations. Each colored line shows the convergence of an individual transition.
Other Images in This Article
Copyright and Terms & Conditions
© 2021. The Author(s). Published by the American Astronomical Society.

Copyright ©
2026 Astronomy Image Explorer. All Rights Reserved.
