

Image Details
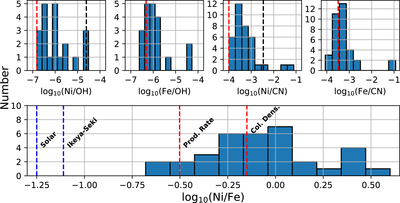
Caption: Figure 8.
Histograms (# bins = 10) of [Ni/OH], [Fe/OH], [Ni/CN], [Fe/CN], and [Ni/Fe] in log10 for all comets with measured nickel and iron production rates to date. Ni, Fe, OH, and CN production rates were taken from Manfroid et al. (2021), Meier et al. (1998), Schleicher & Osip (2002), and Guzik & Drahus (2021). Ratios for 2I/Borisov are indicated by dashed black vertical lines, and ratios for Hyakutake are indicated by red dashed lines. Metal/molecule abundance ratios for Hyakutake were derived from the geometric mean of the constrained range of production rate in Hyakutake; for Ni/Fe, ratios derived from the mean production rates and column densities are both shown.
Other Images in This Article
Copyright and Terms & Conditions
© 2021. The Author(s). Published by the American Astronomical Society.

